Once the frames have been captured and formatted, we can proceed to the analysis. This step can be very difficult, especially when we don’t yet know what we are looking for. To do this, Wireshark offers several tools that will allow us to better target the research, however it is essential to have a minimum of knowledge of WLAN exchanges, packet format, and the various parameters. For this, I refer you to the CWAP training course, which is very complete on the subject.
1 Decrypt a frame
To make application analysis easier, it can be interesting to decrypt the frames and thus see the content of the exchanges. To do this, go to the menu “Edit” > “Preferences” > “Protocols” > “IEEE 802.11” and make sure that the box “Enable decryption” is checked. Then to add keys, you have to click on the button “Edit …” in front of “Decryption keys”.

In the window that opens you can add keys, depending on the type of encryption used you have several possibilities:
- If you are using WEP : You have to select the wep key type and then enter the key (10 numeric values or 26 alphanumeric characters)
- If you are using WPA/WPA2 PSK : You can use the key type “wpa-pwd” or “wpa-psk”.
- For wpa-pwd you have to fill in the key and then the name of the ssid according to the following format: key:ssid
- For wpa-psk you have to fill in the pre-shared key in 64byte hexadecimal format
- If you are using WPA/WPA2 Enterprise: You can select wpa-psk and fill in the PMK key that you can retrieve from the client or from the Radius server
2 Visualization filters
One very important element in the analysis with Wireshark is the visualization filters. They allow you to display only the packets that match the specified filter. The advantage over capture filters is that they allow you to keep all the packets for future use.
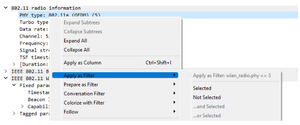
To find a display filter, it is possible to go to the details of a package, to select the field that interests us, by simply clicking on it the name of the field appears in the bottom bar. By right-clicking on it, then “Apply as filter” it is possible to directly select the field with the value of the package to be able to find all the other packages that correspond to this criterion (choice “Selected”) or on the contrary to exclude all the packages corresponding to this criterion (choice “Not Selected”).

You can also write your own filter with the help of the Wireshark references here: https://www.wireshark.org/docs/dfref/w/wlan.html
or by using this compilation which includes a lot of very useful filters:
Macros
When we use several filters one after the other, they quickly become quite difficult to read and to facilitate this we can use macros. Macros will allow us to create pre-defined filters in which we will only have to add parameters. To create a macro, go to the menu bar, choose the “Analyze” menu and then “Display Filter Macros”.
Here is an example of a macro called “low_rssi”:
wlan_radio.signal_dbm <= $1 && wlan_radio.channel == $2 && wlan.ssid==$3
To use it, I will simply call it in the display filters bar by replacing $1 by the desired value, $2 by the desired value, and $3 by the desired value. This gives for example :
${low_rssi:-77;36;SSID1}
It is recommended to create your own macros in order to facilitate their use and to be sure that they correspond to your needs and your way of writing the filters, otherwise you will spend more time finding the order of the parameters and the type of expected value than writing them.
Buttons
During analyses, we notice that we regularly use the same display filters, in order to avoid having to rewrite them each time and to have quicker access to them, we have the possibility to create buttons that will directly apply the chosen filter. To create a button, go to the “Edit” menu, then “Preferences”, then “Filter Buttons”, here is an example of a button :

3 Graphs
In some cases, the visualization of the packets is not enough to analyze the packets and it can be interesting to use graphs to highlight some information. The number of functionalities available with the graphs is very important, I will make here a quick presentation as well as some use cases, but I invite you to dig into this functionality which is very useful to analyze the different exchanges.
Graphs I/O
The I/O graphs are a two-dimensional view in which we can choose the information on the abscissa and ordinate. To access it, go to the Statistics menu and then “I/O Graphs”.
By default, two graphs are already present:

Here is a description of each column and the different possibilities they offer:
- Enabled: Allows you to display or not a line, if it is checked the line will be displayed
- Graph Name : This is the name of the graph
- Display Filter : Display filter that allows to choose the packages we want to use for the graph
- Color : It is the color used for the graph
- Style : It’s the way the graphic is displayed, there are 3 main categories :
- Line: It is a curve that connects all the points in a single line (example above)
- Impulse / Bar and Stacked Bar: Each point is indicated with a bar from the x-axis to the value.
- Dot/Square/Diamond/Cross/Circle/Plus: Each value is indicated by a dot (depending on the shape chosen)
- Y Axis : This is the unit chosen to represent the ordinate axis (taking into account the interval indicated below)
- Packets : Number of packets corresponding to the display filter in the interval
- Bytes / Bits : Number of bytes or bits transmitted in the packets during the interval
- SUM (Y Field): Sum of the values contained in the “Y Field” (shown in the next section)
- MAX (Y Field) / MIN (Y Field): Maximum/minimum value of the “Y Field” field
- AVG (Y Field) : Average value of the “Y Field” field
- LOAD (Y Field): Sum of the “Y Field” fields divided by the interval
- COUNT FRAME (Y Field): Number of packets containing the “Y Field” field
- COUNT FIELD ( Y Field) : Number of occurrences of the “Y Field” field
- Y Field : Name of a field allowing a particular value to be displayed in the Y Axis part
- SMA Period : Allows to display an average of the values during an interval
Here are some examples of graphs:


